

Building products installation services company Installed Building Products (NYSE:IBP) fell short of the market’s revenue expectations in Q4 CY2024 as sales rose 4.1% year on year to $750.2 million. Its non-GAAP profit of $2.88 per share was 0.9% above analysts’ consensus estimates.
Is now the time to buy Installed Building Products? Find out by accessing our full research report, it’s free.
Installed Building Products (IBP) Q4 CY2024 Highlights:
- Revenue: $750.2 million vs analyst estimates of $762.6 million (4.1% year-on-year growth, 1.6% miss)
- Adjusted EPS: $2.88 vs analyst estimates of $2.85 (0.9% beat)
- Adjusted EBITDA: $132 million vs analyst estimates of $131.4 million (17.6% margin, in line)
- Operating Margin: 13.1%, in line with the same quarter last year
- Free Cash Flow Margin: 7.1%, down from 10.4% in the same quarter last year
- Market Capitalization: $4.81 billion
“Our fourth-quarter results capped off another record year for IBP, reinforcing our longstanding commitment to providing residential and commercial customers with high-quality, efficient building product installation services. Record profitability in 2024 drove another year of strong operating cash flow. During 2024, we continued to grow the company by adding over $100 million in annual revenue through acquisitions while distributing a combined $230 million to shareholders through dividends and share repurchases,” stated Jeff Edwards, Chairman and Chief Executive Officer.
Company Overview
Founded in 1977, Installed Building Products (NYSE:IBP) is a company specializing in the installation of insulation, waterproofing, and other complementary building products for residential and commercial construction.
Home Builders
Traditionally, homebuilders have built competitive advantages with economies of scale that lead to advantaged purchasing and brand recognition among consumers. Aesthetic trends have always been important in the space, but more recently, energy efficiency and conservation are driving innovation. However, these companies are still at the whim of the macro, specifically interest rates that heavily impact new and existing home sales. In fact, homebuilders are one of the most cyclical subsectors within industrials.
Sales Growth
A company’s long-term sales performance is one signal of its overall quality. Even a bad business can shine for one or two quarters, but a top-tier one grows for years. Over the last five years, Installed Building Products grew its sales at an exceptional 14.2% compounded annual growth rate. Its growth surpassed the average industrials company and shows its offerings resonate with customers, a great starting point for our analysis.
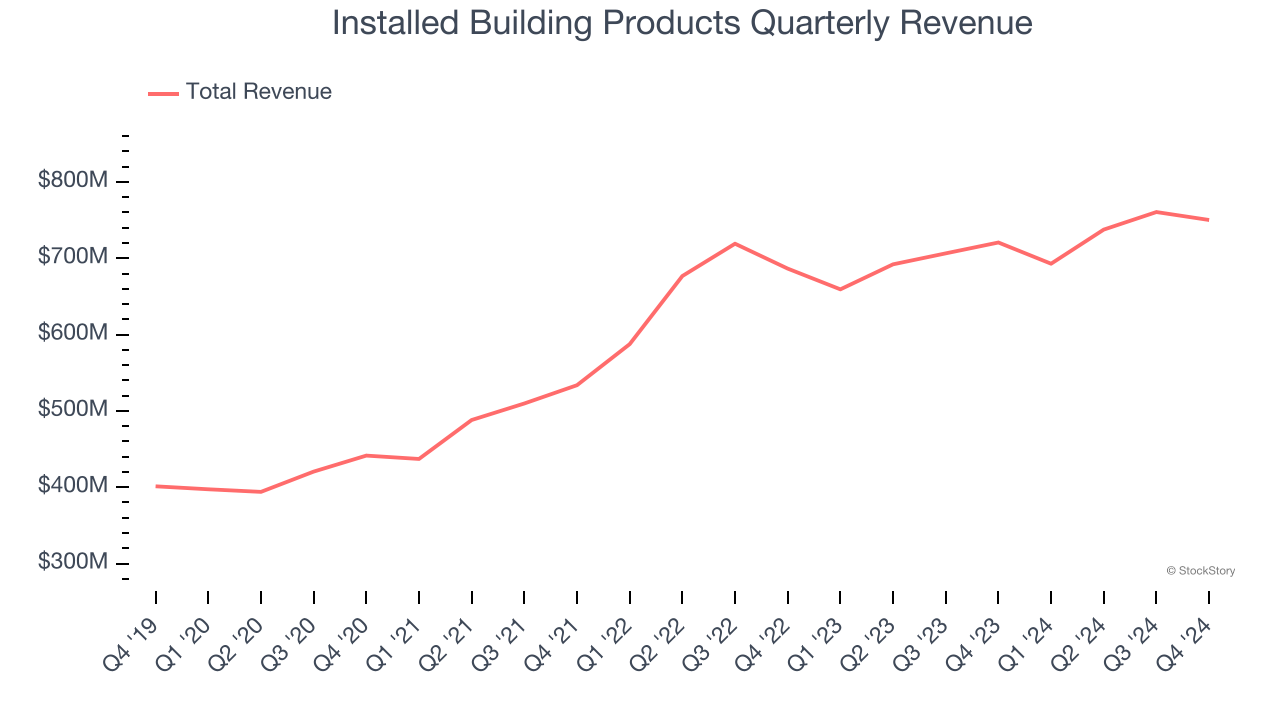
Long-term growth is the most important, but within industrials, a half-decade historical view may miss new industry trends or demand cycles. Installed Building Products’s recent history shows its demand slowed significantly as its annualized revenue growth of 5% over the last two years is well below its five-year trend. 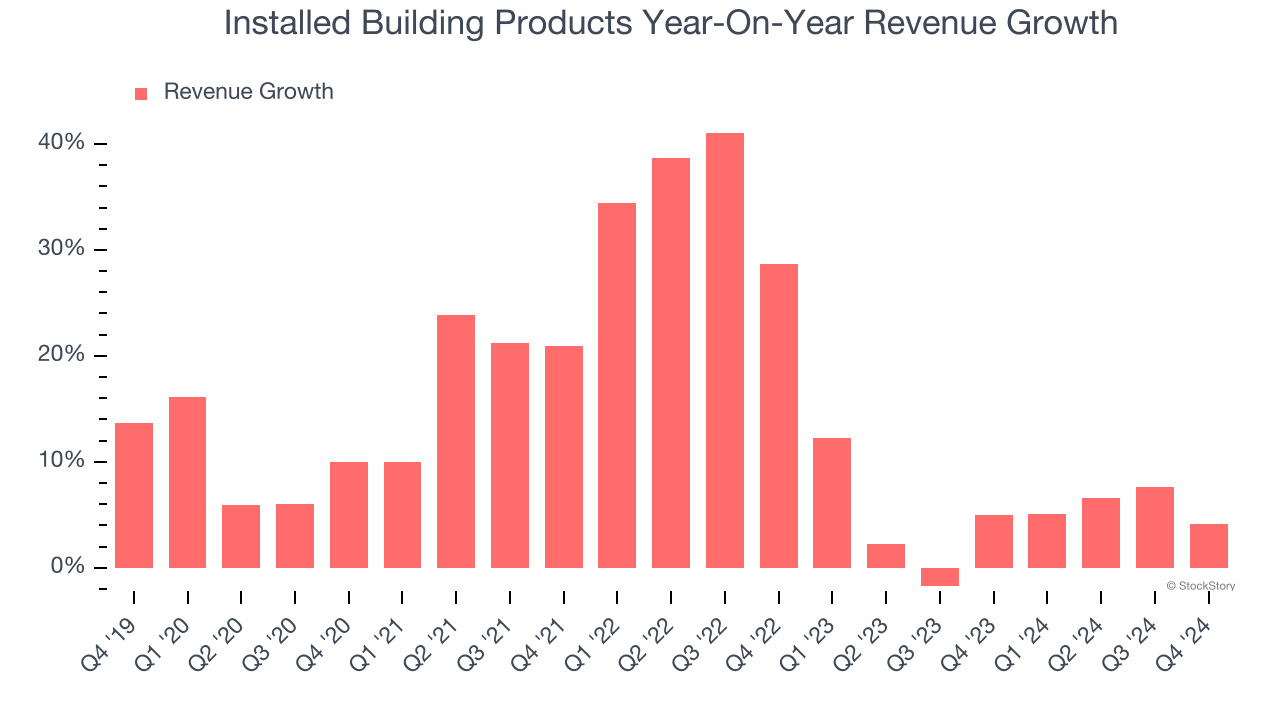
This quarter, Installed Building Products’s revenue grew by 4.1% year on year to $750.2 million, falling short of Wall Street’s estimates.
Looking ahead, sell-side analysts expect revenue to grow 3.9% over the next 12 months, similar to its two-year rate. This projection is underwhelming and suggests its products and services will face some demand challenges. At least the company is tracking well in other measures of financial health.
Unless you’ve been living under a rock, it should be obvious by now that generative AI is going to have a huge impact on how large corporations do business. While Nvidia and AMD are trading close to all-time highs, we prefer a lesser-known (but still profitable) stock benefiting from the rise of AI. Click here to access our free report one of our favorites growth stories.
Operating Margin
Installed Building Products has been an efficient company over the last five years. It was one of the more profitable businesses in the industrials sector, boasting an average operating margin of 12%.
Looking at the trend in its profitability, Installed Building Products’s operating margin rose by 3.2 percentage points over the last five years, as its sales growth gave it operating leverage.
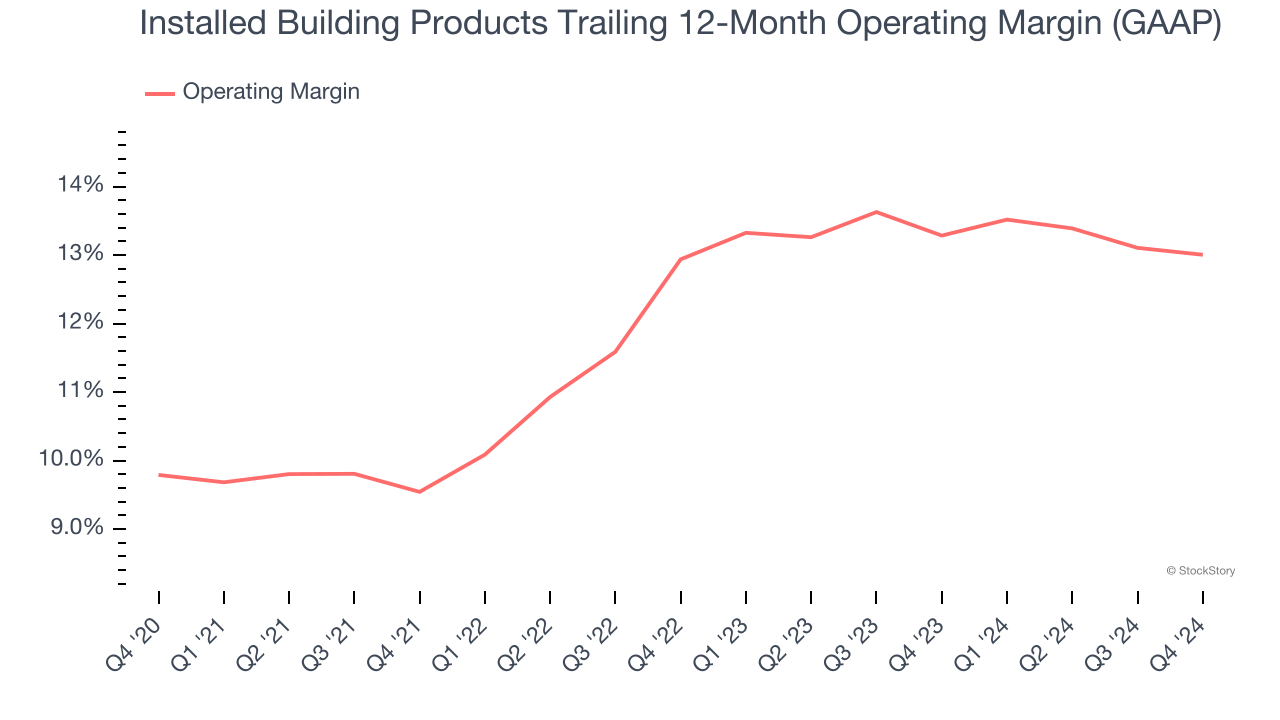
This quarter, Installed Building Products generated an operating profit margin of 13.1%, in line with the same quarter last year. This indicates the company’s cost structure has recently been stable.
Earnings Per Share
We track the long-term change in earnings per share (EPS) for the same reason as long-term revenue growth. Compared to revenue, however, EPS highlights whether a company’s growth is profitable.
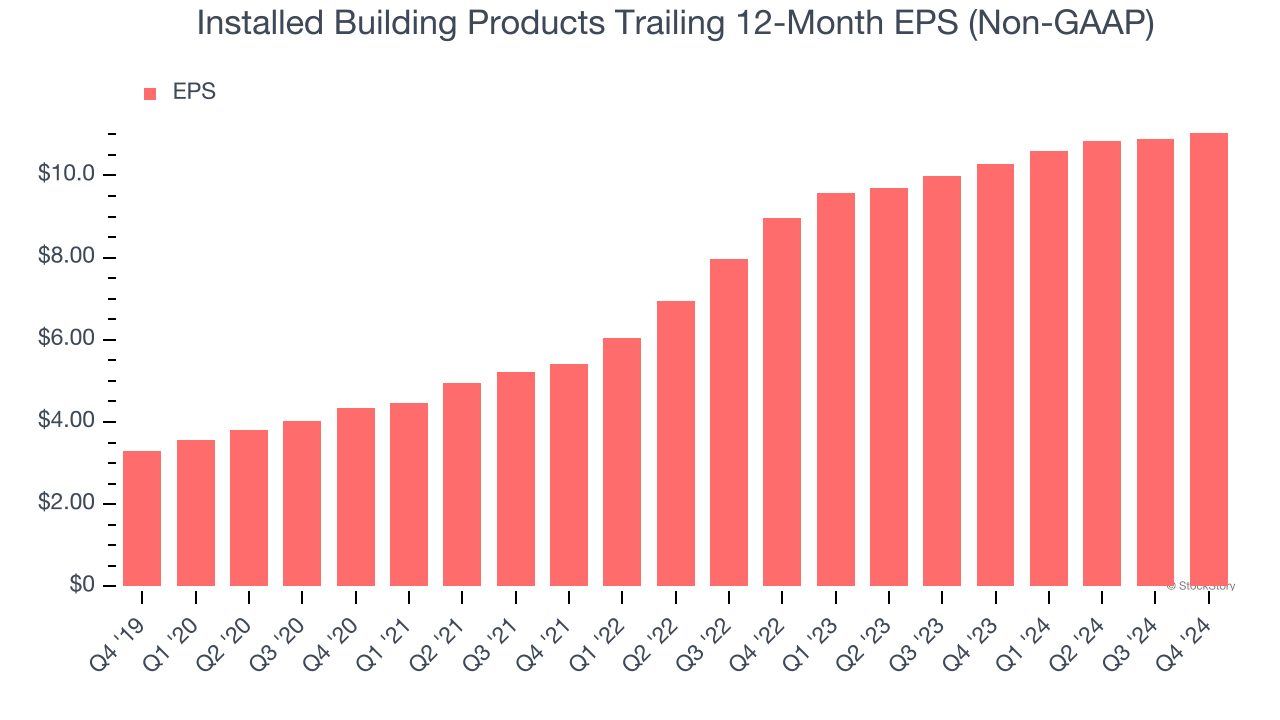
Installed Building Products’s EPS grew at an astounding 27.4% compounded annual growth rate over the last five years, higher than its 14.2% annualized revenue growth. This tells us the company became more profitable on a per-share basis as it expanded.
We can take a deeper look into Installed Building Products’s earnings to better understand the drivers of its performance. As we mentioned earlier, Installed Building Products’s operating margin was flat this quarter but expanded by 3.2 percentage points over the last five years. On top of that, its share count shrank by 6.8%. These are positive signs for shareholders because improving profitability and share buybacks turbocharge EPS growth relative to revenue growth. 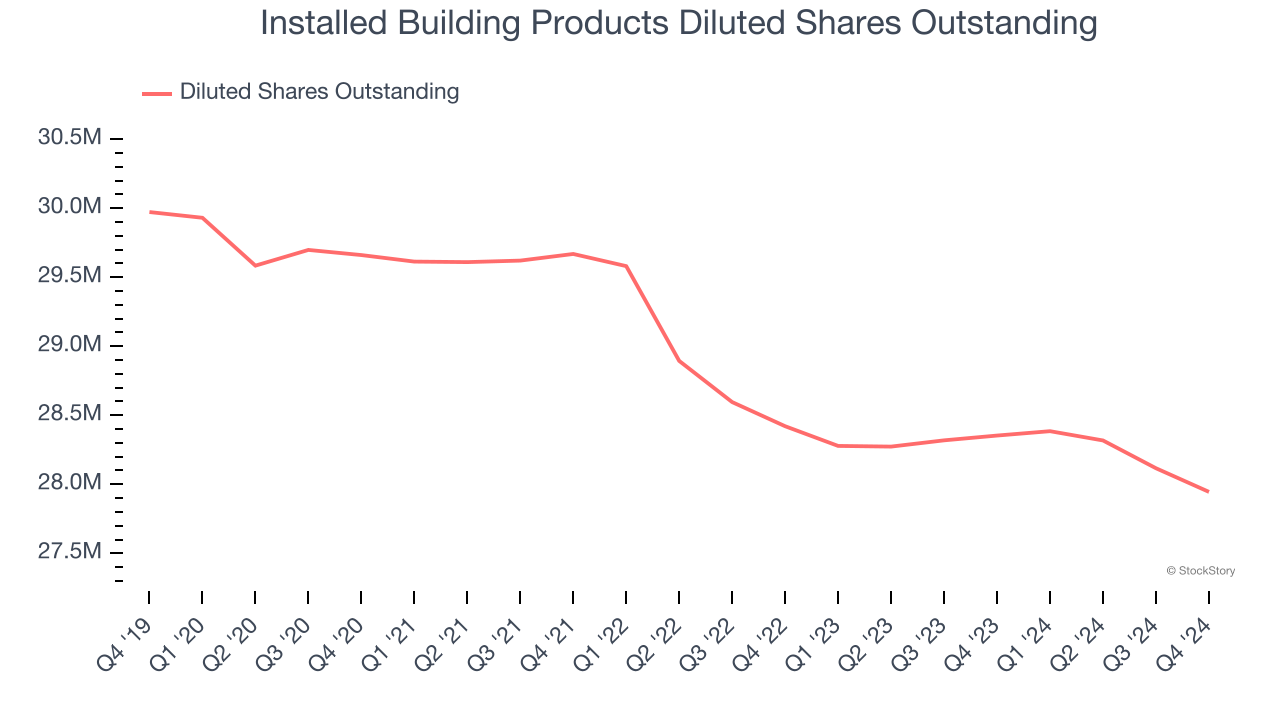
Like with revenue, we analyze EPS over a shorter period to see if we are missing a change in the business.
For Installed Building Products, its two-year annual EPS growth of 11% was lower than its five-year trend. We still think its growth was good and hope it can accelerate in the future.
In Q4, Installed Building Products reported EPS at $2.88, up from $2.72 in the same quarter last year. This print was close to analysts’ estimates. Over the next 12 months, Wall Street expects Installed Building Products’s full-year EPS of $11.04 to grow 3.6%.
Key Takeaways from Installed Building Products’s Q4 Results
Revenue missed, but EPS beat. Overall, this was a mixed quarter. The stock traded up 3.7% to $178 immediately following the results.
Is Installed Building Products an attractive investment opportunity at the current price? We think that the latest quarter is only one piece of the longer-term business quality puzzle. Quality, when combined with valuation, can help determine if the stock is a buy. We cover that in our actionable full research report which you can read here, it’s free.