

Healthcare solutions provider Solventum (NYSE:SOLV) reported revenue ahead of Wall Street’s expectations in Q4 CY2024, with sales up 1.9% year on year to $2.07 billion. Its non-GAAP profit of $1.41 per share was 7.8% above analysts’ consensus estimates.
Is now the time to buy Solventum? Find out by accessing our full research report, it’s free.
Solventum (SOLV) Q4 CY2024 Highlights:
- Revenue: $2.07 billion vs analyst estimates of $2.05 billion (1.9% year-on-year growth, 1.2% beat)
- Adjusted EPS: $1.41 vs analyst estimates of $1.31 (7.8% beat)
- Adjusted EPS guidance for the upcoming financial year 2025 is $5.55 at the midpoint, beating analyst estimates by 1.1%
- Operating Margin: 6.6%, down from 19.9% in the same quarter last year
- Free Cash Flow Margin: 4.4%, down from 22.5% in the same quarter last year
- Organic Revenue rose 2.3% year on year (0.9% in the same quarter last year)
- Market Capitalization: $14.52 billion
Company Overview
Founded in 1985, Solventum (NYSE:SOLV) develops, manufactures, and commercializes a portfolio of healthcare products and services addressing critical customer and therapeutic patient needs.
Surgical Equipment & Consumables - Diversified
The surgical equipment and consumables industry provides tools, devices, and disposable products essential for surgeries and medical procedures. These companies therefore benefit from relatively consistent demand, driven by the ongoing need for medical interventions, recurring revenue from consumables, and long-term contracts with hospitals and healthcare providers. However, the high costs of R&D and regulatory compliance, coupled with intense competition and pricing pressures from cost-conscious customers, can constrain profitability. Over the next few years, tailwinds include aging populations, which tend to need surgical interventions at higher rates. The increasing integration of AI and robotics into surgical procedures could also create opportunities for differentiation and innovation. However, the industry faces headwinds including potential supply chain vulnerabilities, evolving regulatory requirements, and more widespread efforts to make healthcare less costly.
Sales Growth
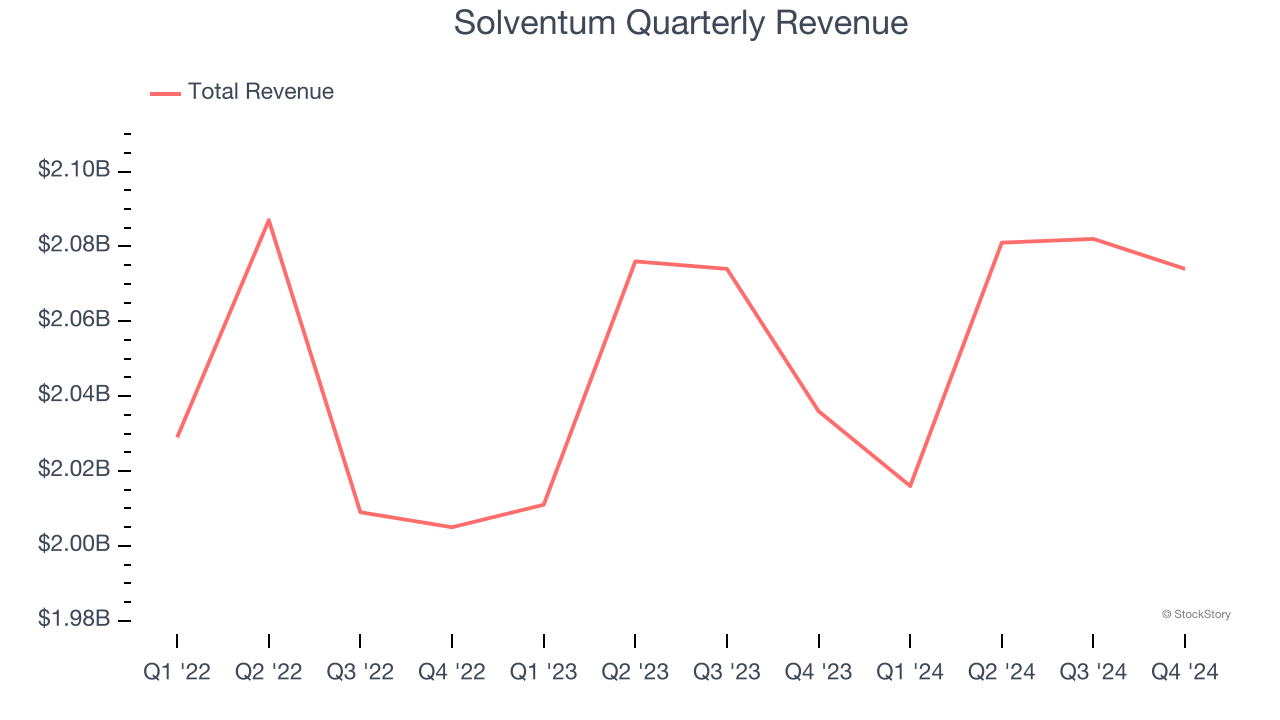
Examining a company’s long-term performance can provide clues about its quality. Any business can put up a good quarter or two, but the best consistently grow over the long haul. Unfortunately, Solventum struggled to consistently increase demand as its $8.25 billion of sales for the trailing 12 months was close to its revenue two years ago. This wasn’t a great result and is a sign of poor business quality.
Solventum also reports organic revenue, which strips out one-time events like acquisitions and currency fluctuations that don’t accurately reflect its fundamentals. Over the last two years, Solventum’s organic revenue averaged 1.3% year-on-year growth. Because this number aligns with its normal revenue growth, we can see the company’s core operations (not acquisitions and divestitures) drove most of its results. 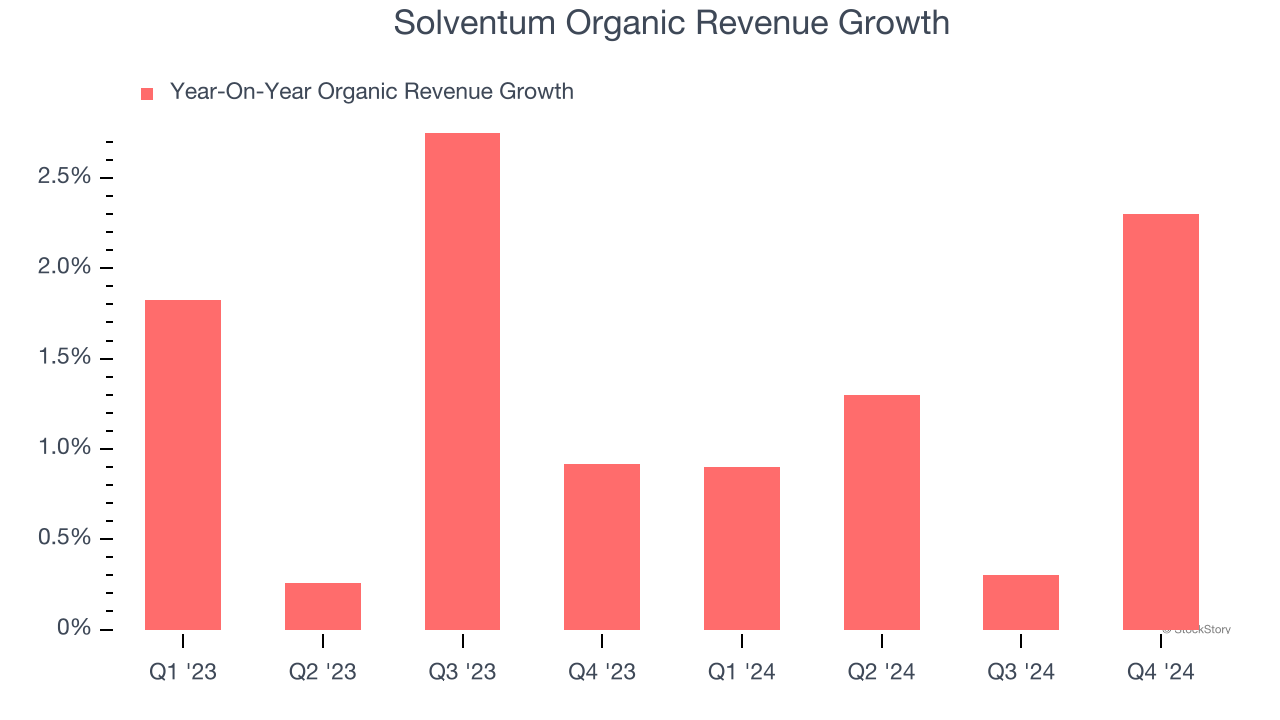
This quarter, Solventum reported modest year-on-year revenue growth of 1.9% but beat Wall Street’s estimates by 1.2%.
Looking ahead, sell-side analysts expect revenue to remain flat over the next 12 months. This projection is underwhelming and indicates its newer products and services will not accelerate its top-line performance yet.
Software is eating the world and there is virtually no industry left that has been untouched by it. That drives increasing demand for tools helping software developers do their jobs, whether it be monitoring critical cloud infrastructure, integrating audio and video functionality, or ensuring smooth content streaming. Click here to access a free report on our 3 favorite stocks to play this generational megatrend.
Operating Margin
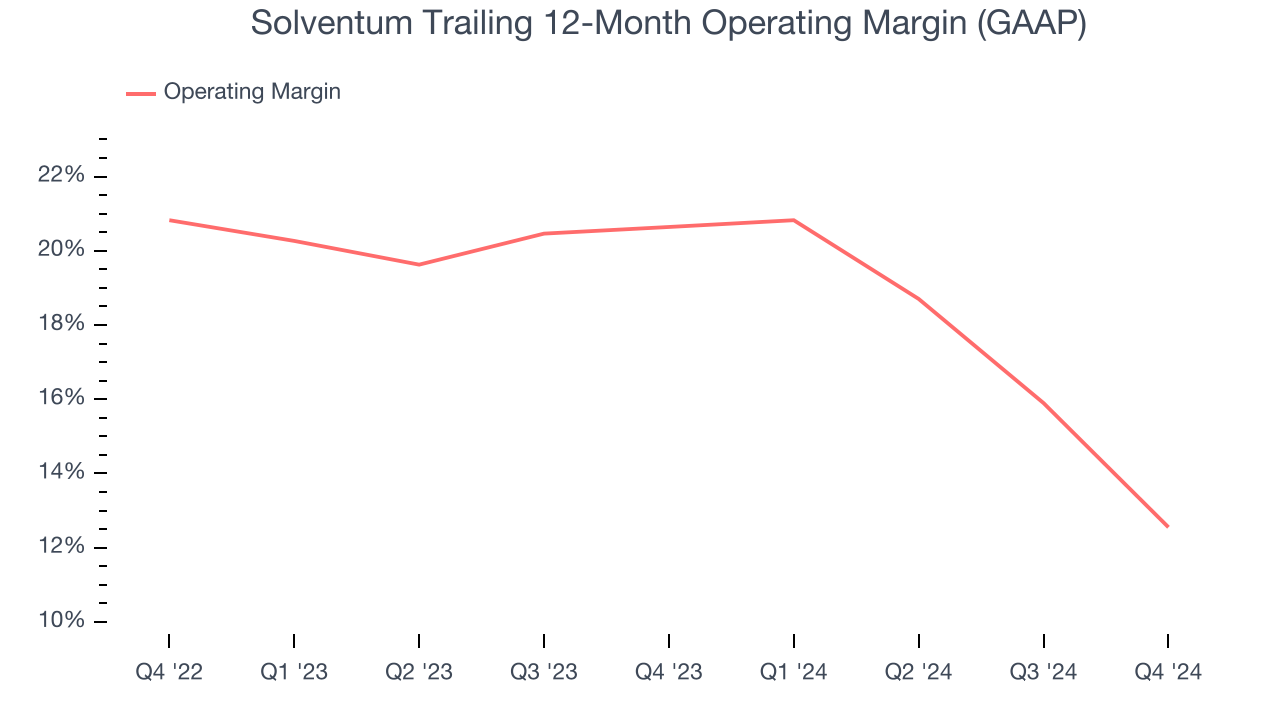
In Q4, Solventum generated an operating profit margin of 6.6%, down 13.4 percentage points year on year. This contraction shows it was recently less efficient because its expenses grew faster than its revenue.
Earnings Per Share
We track the change in earnings per share (EPS) for the same reason as long-term revenue growth. Compared to revenue, however, EPS highlights whether a company’s growth is profitable.
Sadly for Solventum, its EPS declined by 18.2% annually over the last two years while its revenue was flat. This tells us the company struggled because its fixed cost base made it difficult to adjust to choppy demand.
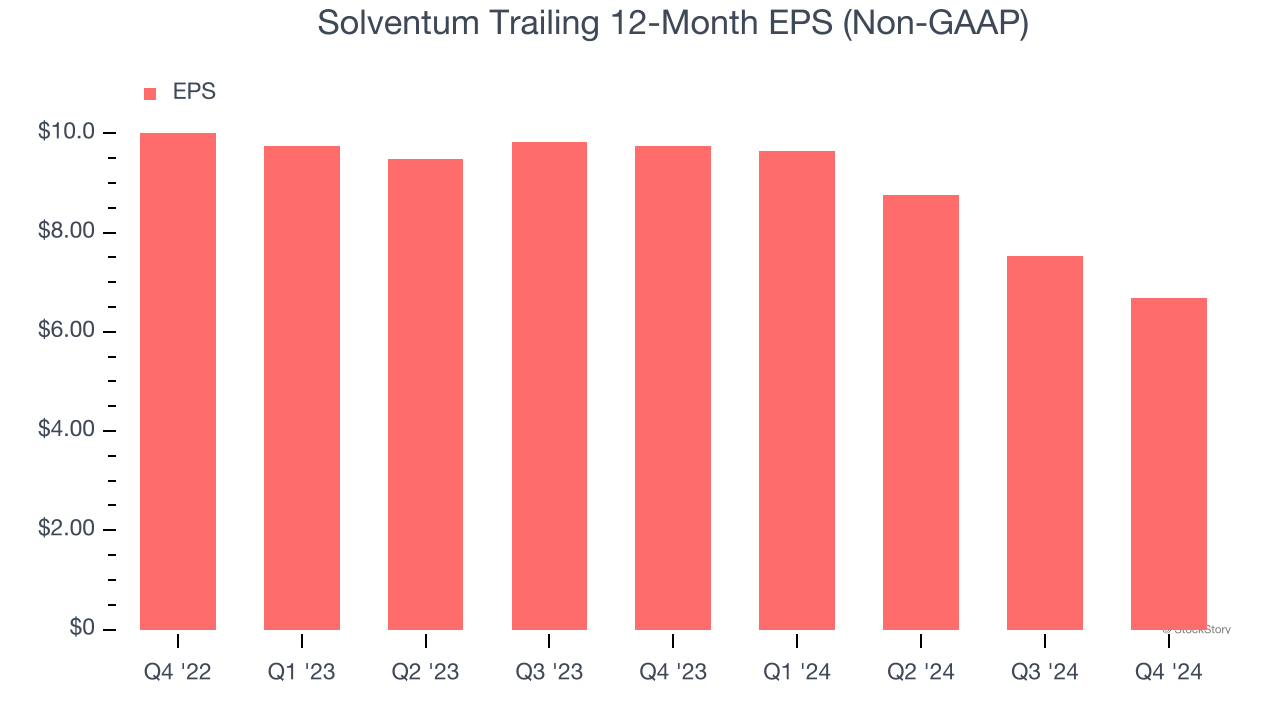
In Q4, Solventum reported EPS at $1.41, down from $2.25 in the same quarter last year. Despite falling year on year, this print beat analysts’ estimates by 7.8%. Over the next 12 months, Wall Street expects Solventum’s full-year EPS of $6.69 to shrink by 18.4%.
Key Takeaways from Solventum’s Q4 Results
It was good to see Solventum narrowly top analysts’ organic revenue expectations this quarter. We were also happy its EPS outperformed Wall Street’s estimates. On the other hand, its full-year EPS guidance missed. Overall, we think this was a mixed quarter. The areas below expectations seem to be driving the move, and shares traded down 2.4% to $81.30 immediately following the results.
Is Solventum an attractive investment opportunity at the current price? If you’re making that decision, you should consider the bigger picture of valuation, business qualities, as well as the latest earnings. We cover that in our actionable full research report which you can read here, it’s free.