

Gas handling company Chart (NYSE:GTLS) fell short of the market’s revenue expectations in Q4 CY2024, but sales rose 9% year on year to $1.11 billion. On the other hand, the company’s full-year revenue guidance of $4.75 billion at the midpoint came in 1.4% above analysts’ estimates. Its non-GAAP profit of $2.66 per share was 15.5% below analysts’ consensus estimates.
Is now the time to buy Chart? Find out by accessing our full research report, it’s free.
Chart (GTLS) Q4 CY2024 Highlights:
- Revenue: $1.11 billion vs analyst estimates of $1.17 billion (9% year-on-year growth, 5.2% miss)
- Adjusted EPS: $2.66 vs analyst expectations of $3.15 (15.5% miss)
- Adjusted EBITDA: $283.6 million vs analyst estimates of $292.5 million (25.6% margin, 3% miss)
- Management’s revenue guidance for the upcoming financial year 2025 is $4.75 billion at the midpoint, beating analyst estimates by 1.4% and implying 14.2% growth (vs 29.7% in FY2024)
- Adjusted EPS guidance for the upcoming financial year 2025 is $12.50 at the midpoint, beating analyst estimates by 0.8%
- EBITDA guidance for the upcoming financial year 2025 is $1.2 billion at the midpoint, above analyst estimates of $1.18 billion
- Operating Margin: 17%, up from 15.4% in the same quarter last year
- Free Cash Flow Margin: 23.6%, up from 11.1% in the same quarter last year
- Backlog: $4.85 billion at quarter end, up 13.2% year on year
- Market Capitalization: $7.66 billion
“Increasing demand for energy globally and a renewed focus on U.S. LNG contributed to record orders in the fourth quarter 2024 of $1.55 billion, setting up 2025 with strong backlog to achieve our reiterated full year 2025 outlook,” stated Jill Evanko, Chart Industries’ CEO and President.
Company Overview
Installing the first bulk Co2 tank for McDonalds’s sodas, Chart (NYSE:GTLS) provides equipment to store and transport gasses.
Gas and Liquid Handling
Gas and liquid handling companies possess the technical know-how and specialized equipment to handle valuable (and sometimes dangerous) substances. Lately, water conservation and carbon capture–which requires hydrogen and other gasses as well as specialized infrastructure–have been trending up, creating new demand for products such as filters, pumps, and valves. On the other hand, gas and liquid handling companies are at the whim of economic cycles. Consumer spending and interest rates, for example, can greatly impact the industrial production that drives demand for these companies’ offerings.
Sales Growth
Reviewing a company’s long-term sales performance reveals insights into its quality. Any business can have short-term success, but a top-tier one grows for years. Thankfully, Chart’s 27.9% annualized revenue growth over the last five years was incredible. Its growth surpassed the average industrials company and shows its offerings resonate with customers, a great starting point for our analysis.
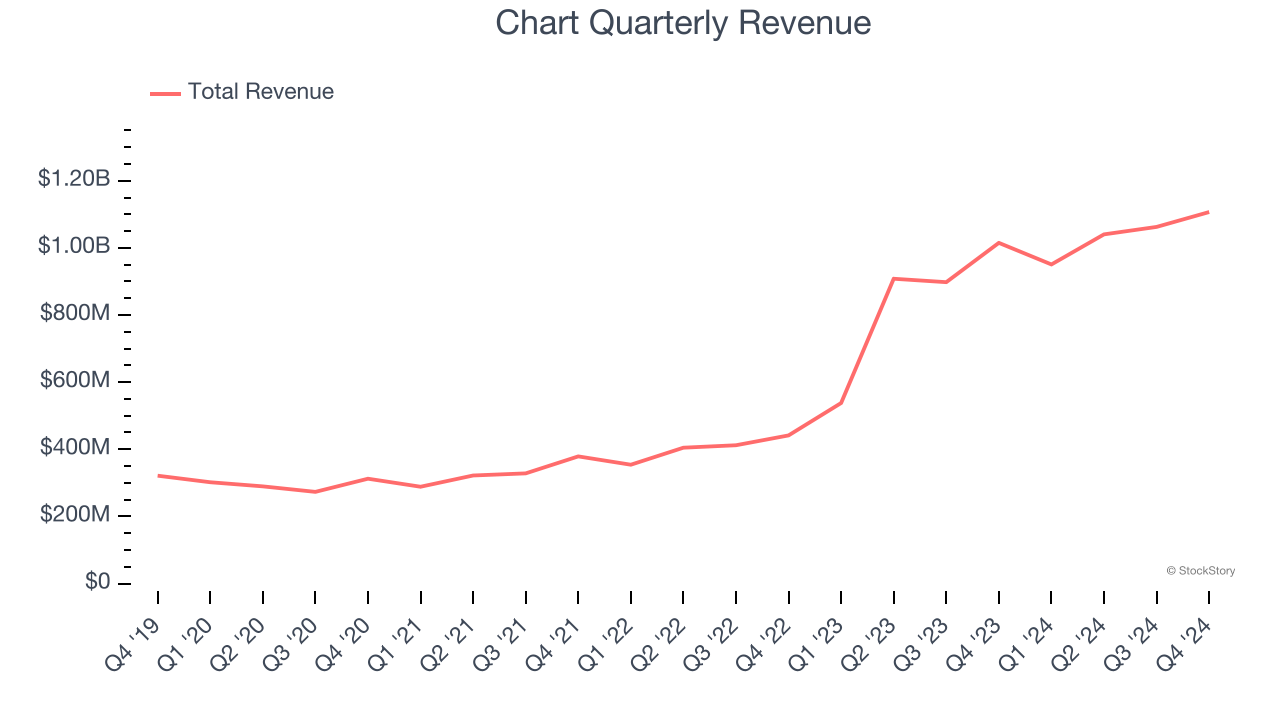
We at StockStory place the most emphasis on long-term growth, but within industrials, a half-decade historical view may miss cycles, industry trends, or a company capitalizing on catalysts such as a new contract win or a successful product line. Chart’s annualized revenue growth of 60.6% over the last two years is above its five-year trend, suggesting its demand was strong and recently accelerated. 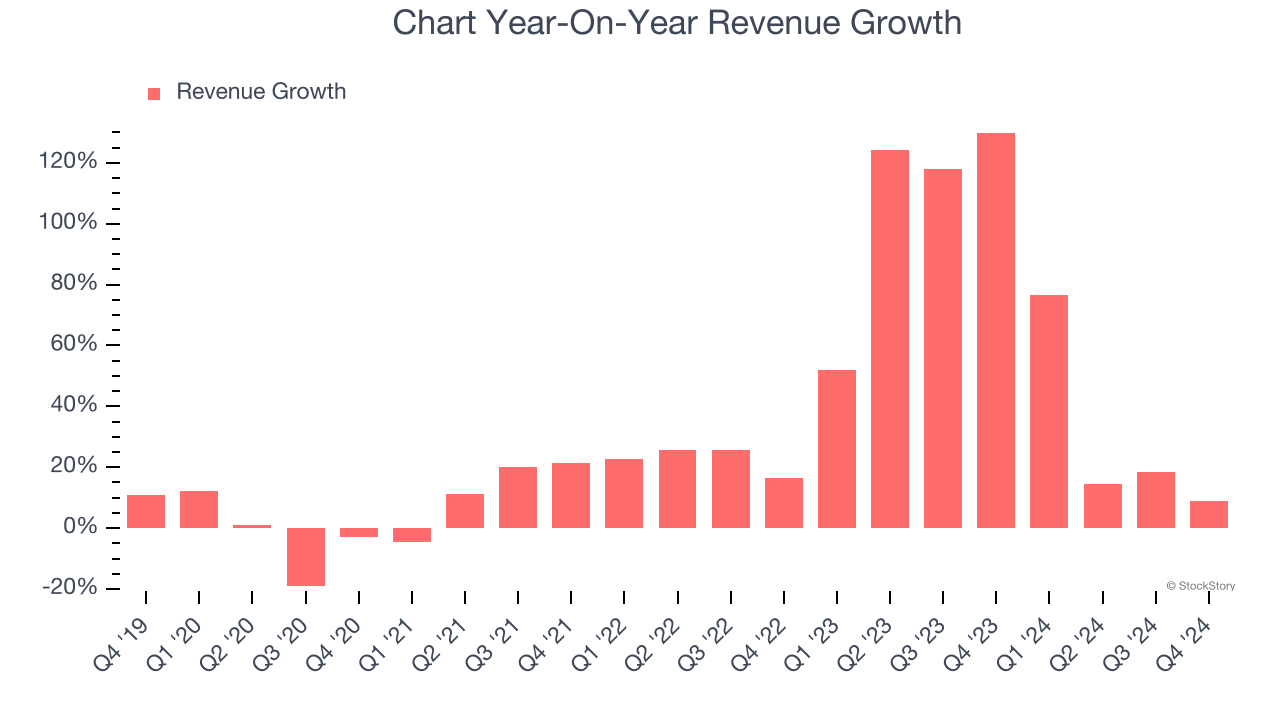
Chart also reports its backlog, or the value of its outstanding orders that have not yet been executed or delivered. Chart’s backlog reached $4.85 billion in the latest quarter and averaged 60.1% year-on-year growth over the last two years. Because this number is in line with its revenue growth, we can see the company effectively balanced its new order intake and fulfillment processes. 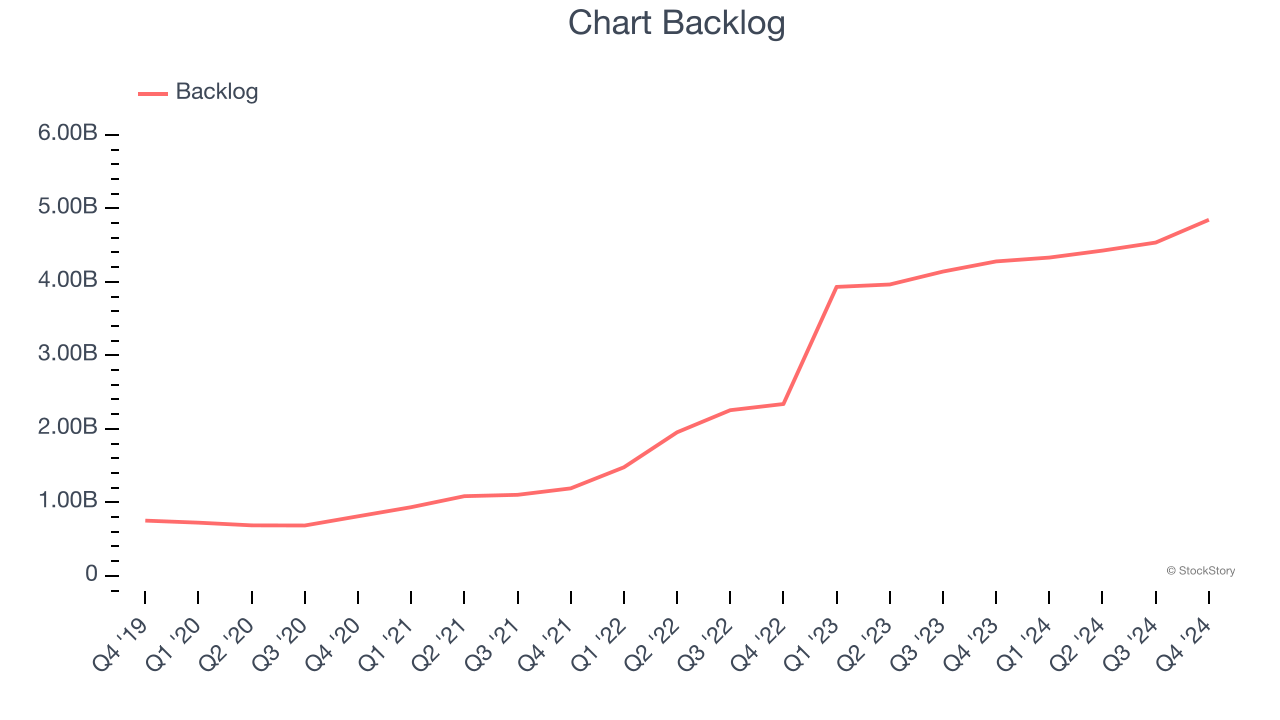
This quarter, Chart’s revenue grew by 9% year on year to $1.11 billion, missing Wall Street’s estimates.
Looking ahead, sell-side analysts expect revenue to grow 12.5% over the next 12 months, a deceleration versus the last two years. Despite the slowdown, this projection is healthy and indicates the market is forecasting success for its products and services.
Here at StockStory, we certainly understand the potential of thematic investing. Diverse winners from Microsoft (MSFT) to Alphabet (GOOG), Coca-Cola (KO) to Monster Beverage (MNST) could all have been identified as promising growth stories with a megatrend driving the growth. So, in that spirit, we’ve identified a relatively under-the-radar profitable growth stock benefiting from the rise of AI, available to you FREE via this link.
Operating Margin
Operating margin is a key measure of profitability. Think of it as net income - the bottom line - excluding the impact of taxes and interest on debt, which are less connected to business fundamentals.
Chart has been an efficient company over the last five years. It was one of the more profitable businesses in the industrials sector, boasting an average operating margin of 11.8%.
Looking at the trend in its profitability, Chart’s operating margin rose by 7.7 percentage points over the last five years, as its sales growth gave it immense operating leverage.
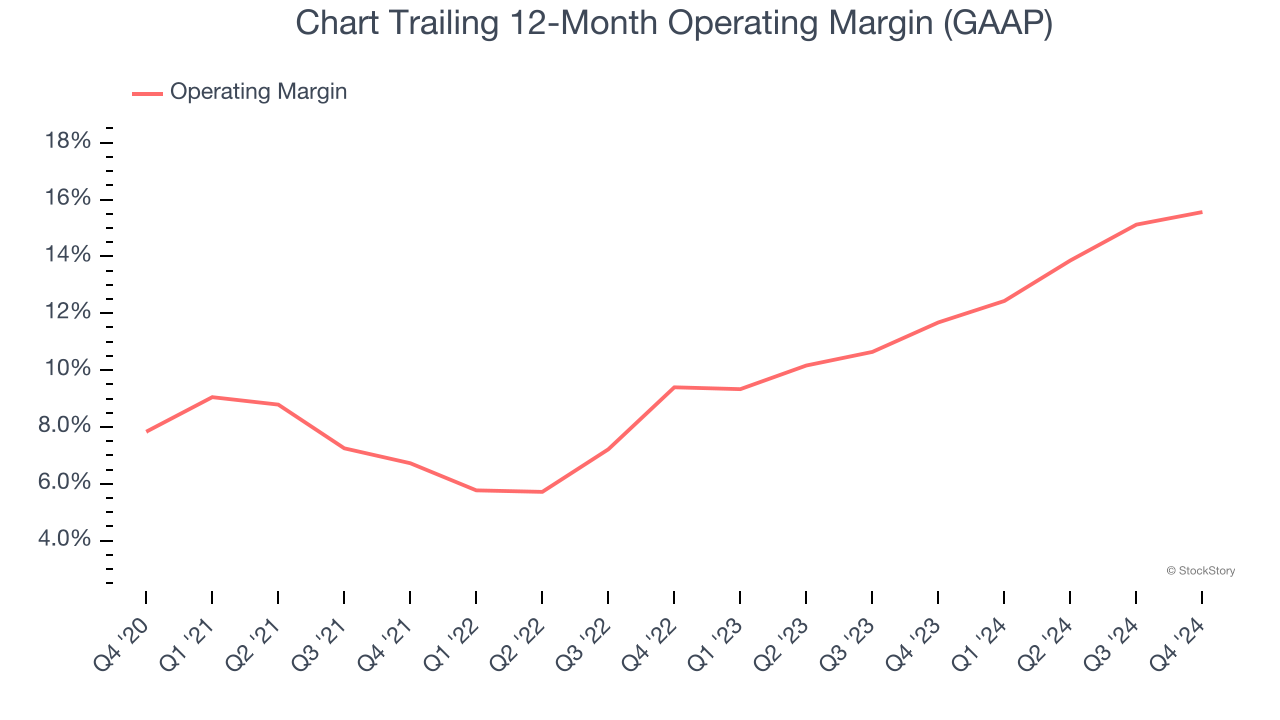
This quarter, Chart generated an operating profit margin of 17%, up 1.6 percentage points year on year. The increase was encouraging, and since its gross margin actually decreased, we can assume it was recently more efficient because its operating expenses like marketing, R&D, and administrative overhead grew slower than its revenue.
Earnings Per Share
We track the long-term change in earnings per share (EPS) for the same reason as long-term revenue growth. Compared to revenue, however, EPS highlights whether a company’s growth is profitable.
Chart’s EPS grew at an astounding 26.2% compounded annual growth rate over the last five years. Despite its operating margin expansion during that time, this performance was lower than its 27.9% annualized revenue growth, telling us that non-fundamental factors such as interest and taxes affected its ultimate earnings.
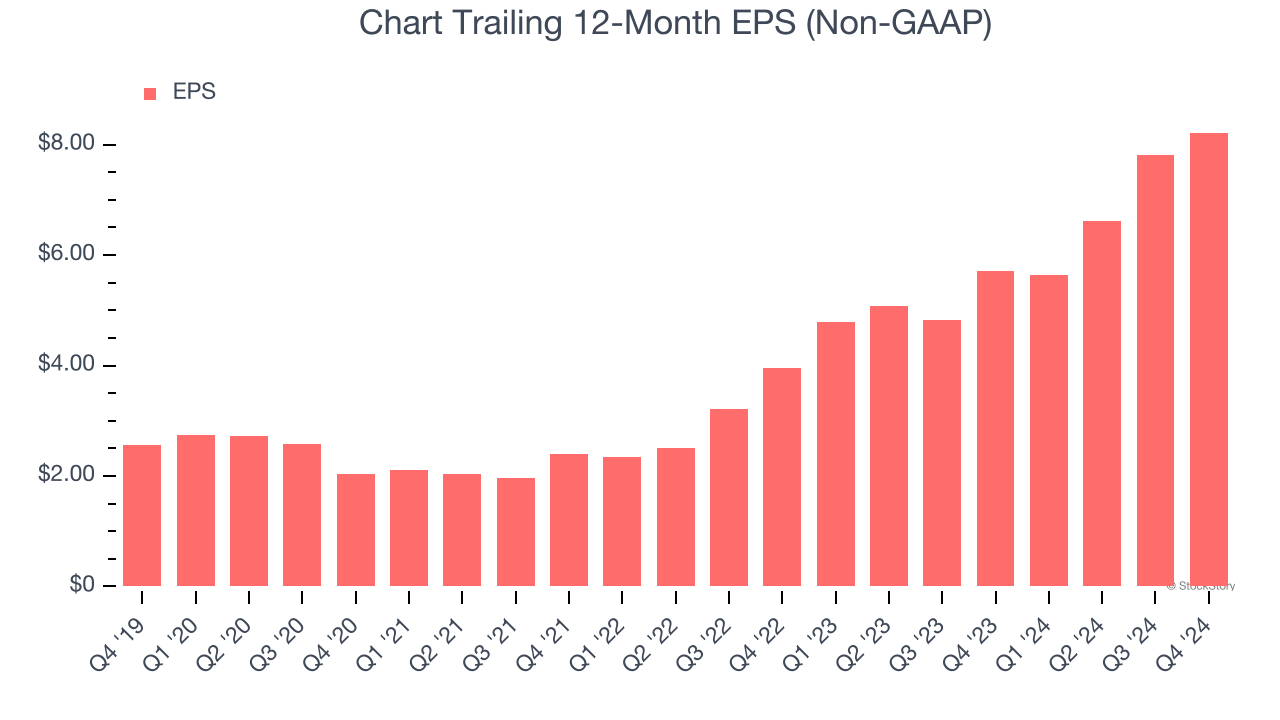
Diving into Chart’s quality of earnings can give us a better understanding of its performance. A five-year view shows Chart has diluted its shareholders, growing its share count by 27.4%. This dilution overshadowed its increased operating efficiency and has led to lower per share earnings. Taxes and interest expenses can also affect EPS but don’t tell us as much about a company’s fundamentals. 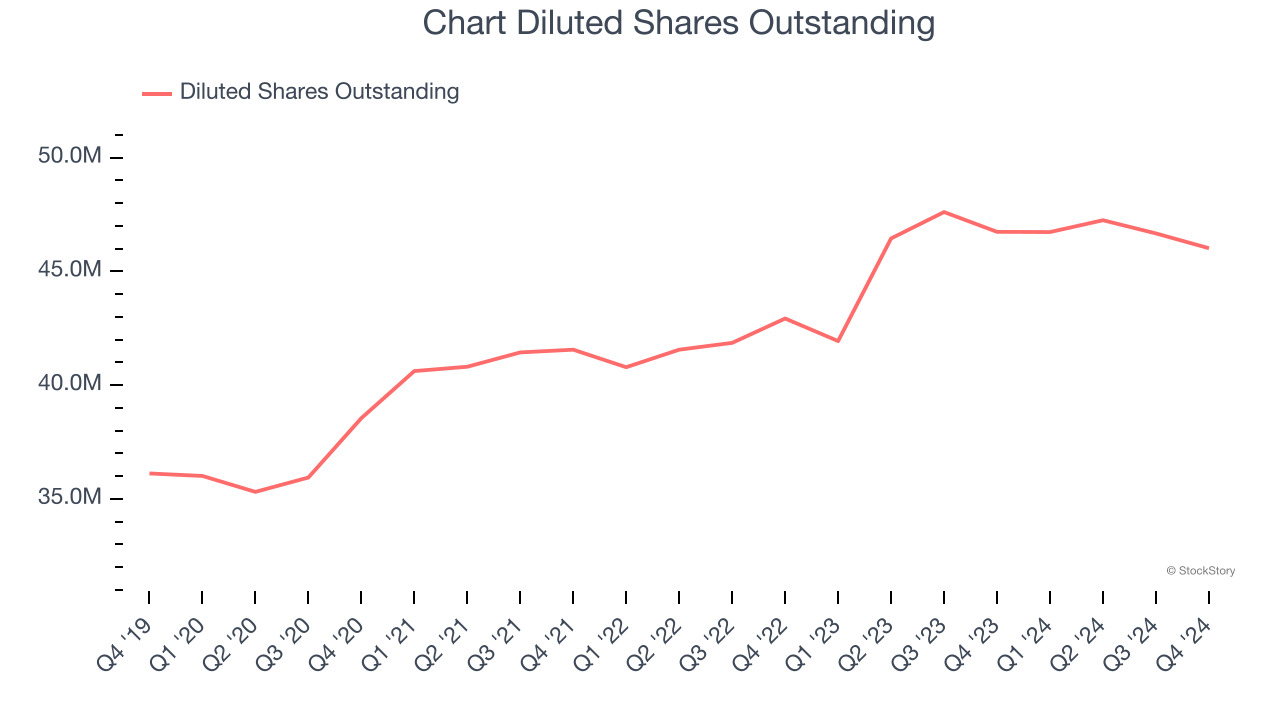
Like with revenue, we analyze EPS over a shorter period to see if we are missing a change in the business.
For Chart, its two-year annual EPS growth of 44.2% was higher than its five-year trend. We love it when earnings growth accelerates, especially when it accelerates off an already high base.
In Q4, Chart reported EPS at $2.66, up from $2.25 in the same quarter last year. Despite growing year on year, this print missed analysts’ estimates, but we care more about long-term EPS growth than short-term movements. Over the next 12 months, Wall Street expects Chart’s full-year EPS of $8.22 to grow 50.8%.
Key Takeaways from Chart’s Q4 Results
We were impressed by how significantly Chart blew past analysts’ backlog expectations this quarter. We were also glad its full-year EBITDA guidance exceeded Wall Street’s estimates. On the other hand, its revenue and EPS fell short of Wall Street’s estimates. Zooming out, we think this was a mixed quarter. The stock traded up 4.8% to $190.85 immediately following the results.
Should you buy the stock or not? What happened in the latest quarter matters, but not as much as longer-term business quality and valuation, when deciding whether to invest in this stock. We cover that in our actionable full research report which you can read here, it’s free.