

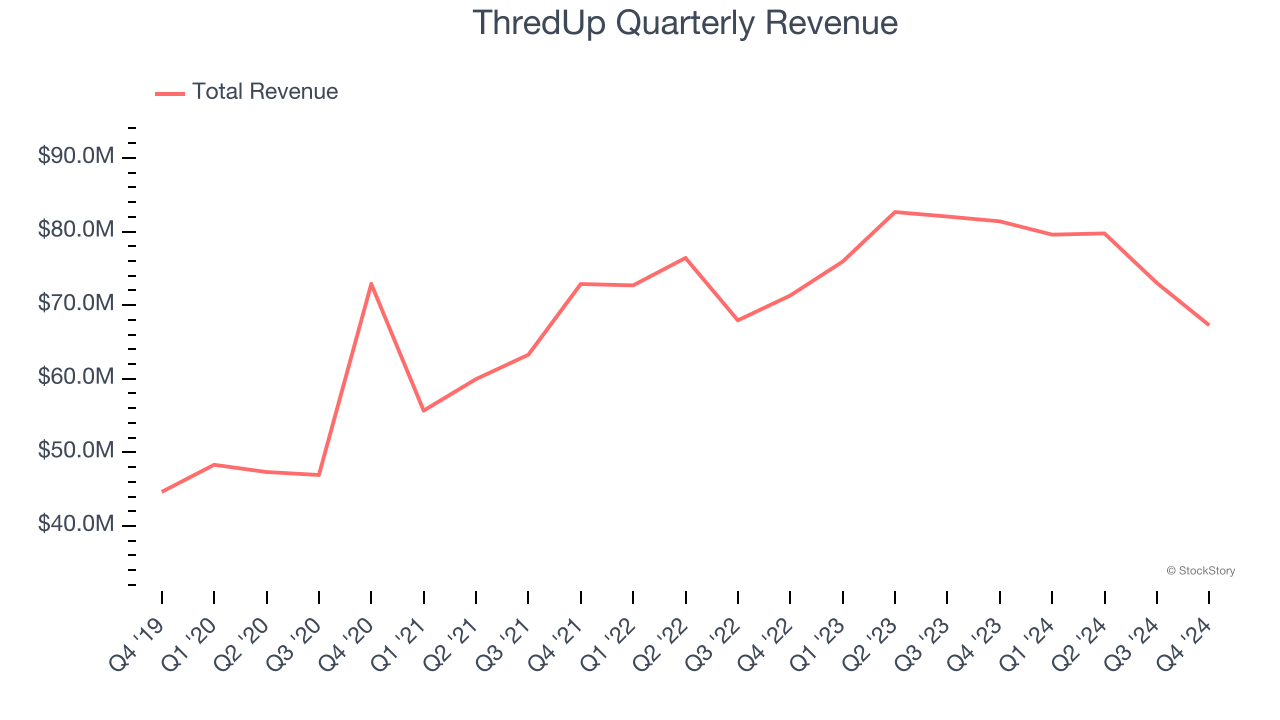
Online fashion resale marketplace ThredUp (NASDAQ:TDUP) fell short of the market’s revenue expectations in Q4 CY2024, with sales falling 17.4% year on year to $67.27 million. On the other hand, next quarter’s outlook exceeded expectations with revenue guided to $68.5 million at the midpoint, or 4.7% above analysts’ estimates. Its GAAP loss of $0.19 per share was significantly below analysts’ consensus estimates.
Is now the time to buy ThredUp? Find out by accessing our full research report, it’s free.
ThredUp (TDUP) Q4 CY2024 Highlights:
- Revenue: $67.27 million vs analyst estimates of $68.93 million (17.4% year-on-year decline, 2.4% miss)
- EPS (GAAP): -$0.19 vs analyst estimates of -$0.07 (significant miss)
- Adjusted EBITDA: $4.99 million vs analyst estimates of $3.89 million (7.4% margin, 28.2% beat)
- Management’s revenue guidance for the upcoming financial year 2025 is $275 million at the midpoint, beating analyst estimates by 4.6% and implying -8.2% growth (vs -6.8% in FY2024)
- Operating Margin: -12.1%, up from -18.1% in the same quarter last year
- Free Cash Flow was $3.91 million, up from -$10.18 million in the same quarter last year
- Orders: 1.27 million, down 533,000 year on year
- Market Capitalization: $268.5 million
“We are proud to have closed out 2024 with a definitive return to growth, while also delivering strong bottom-line results,” said ThredUp CEO and co-founder James Reinhart.
Company Overview
Founded to revolutionize thrifting, ThredUp (NASDAQ:TDUP) is a leading online fashion resale marketplace offering a wide selection of gently-used clothing and accessories.
Apparel and Accessories
Thanks to social media and the internet, not only are styles changing more frequently today than in decades past but also consumers are shifting the way they buy their goods, favoring omnichannel and e-commerce experiences. Some apparel and accessories companies have made concerted efforts to adapt while those who are slower to move may fall behind.
Sales Growth
A company’s long-term sales performance can indicate its overall quality. Any business can put up a good quarter or two, but many enduring ones grow for years. Over the last five years, ThredUp grew its sales at a 12.8% compounded annual growth rate. Although this growth is acceptable on an absolute basis, it fell short of our standards for the consumer discretionary sector, which enjoys a number of secular tailwinds.
We at StockStory place the most emphasis on long-term growth, but within consumer discretionary, a stretched historical view may miss a company riding a successful new product or trend. ThredUp’s recent history shows its demand slowed as its annualized revenue growth of 1.9% over the last two years is below its five-year trend. 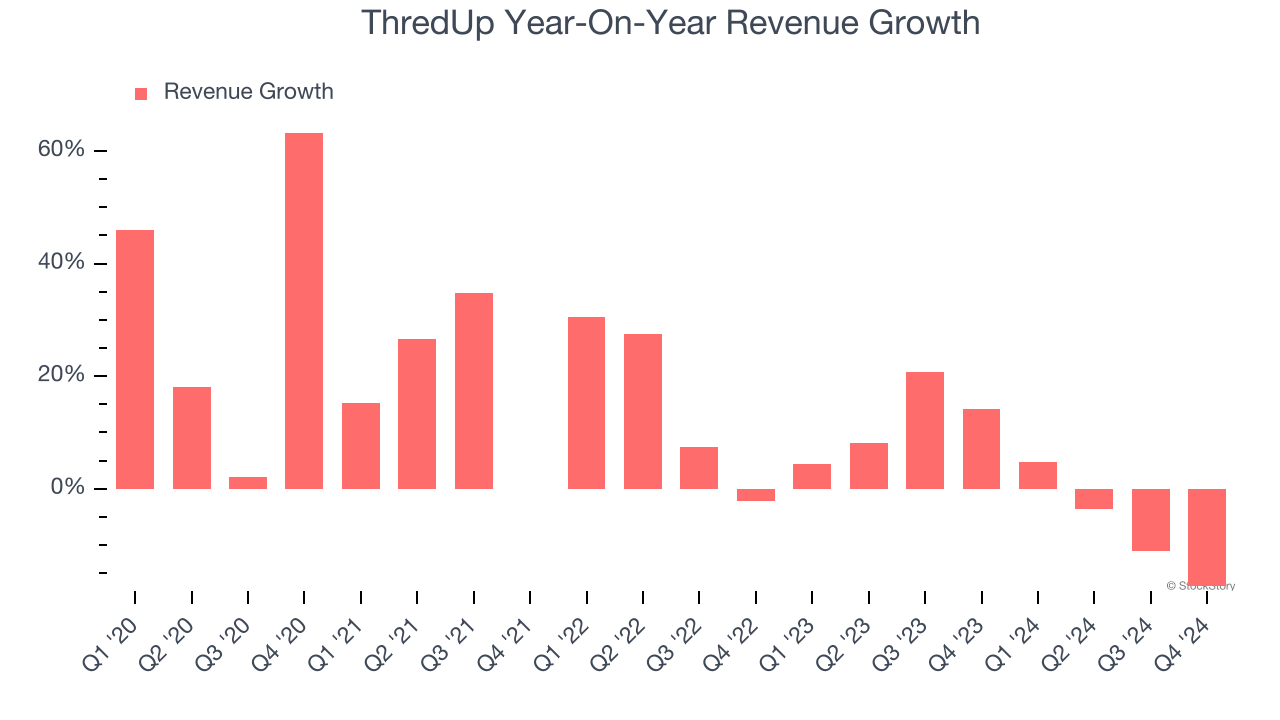
We can dig further into the company’s revenue dynamics by analyzing its number of orders, which reached 1.27 million in the latest quarter. Over the last two years, ThredUp’s orders averaged 1.8% year-on-year declines. Because this number is lower than its revenue growth during the same period, we can see the company’s monetization has risen. 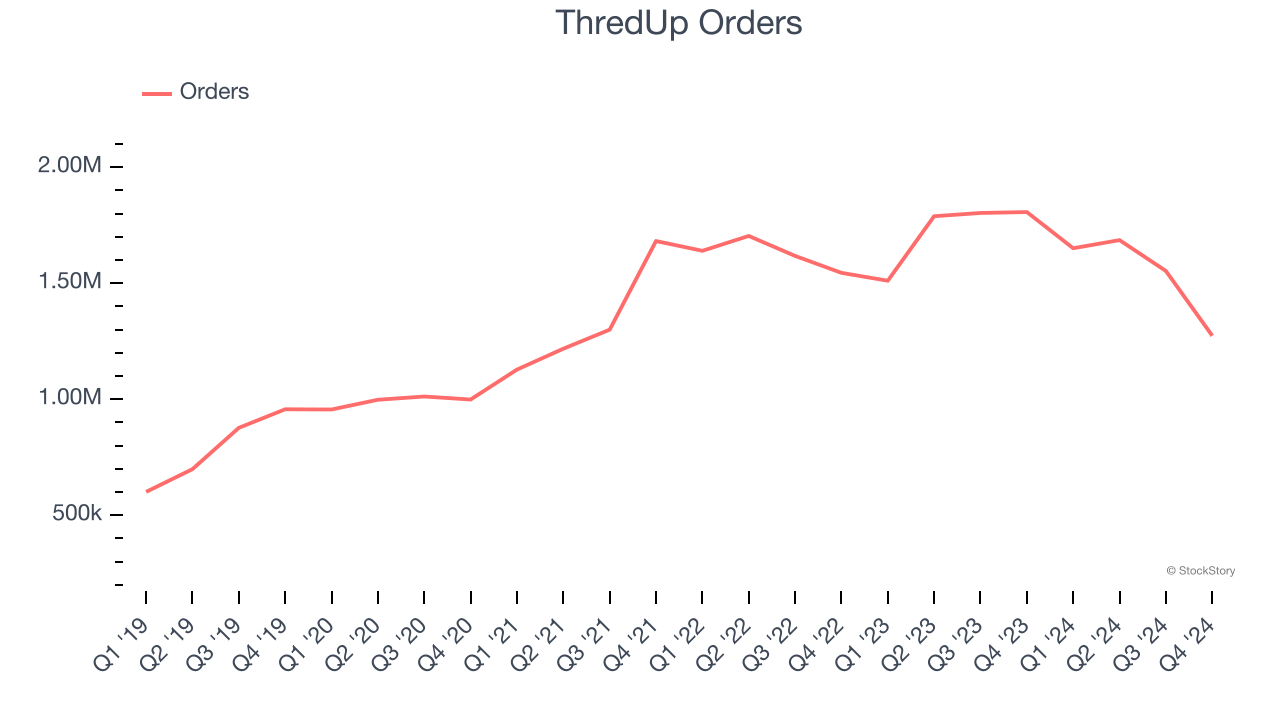
This quarter, ThredUp missed Wall Street’s estimates and reported a rather uninspiring 17.4% year-on-year revenue decline, generating $67.27 million of revenue. Company management is currently guiding for a 13.9% year-on-year decline in sales next quarter.
Looking further ahead, sell-side analysts expect revenue to decline by 10% over the next 12 months, a deceleration versus the last two years. This projection is underwhelming and suggests its products and services will see some demand headwinds.
Unless you’ve been living under a rock, it should be obvious by now that generative AI is going to have a huge impact on how large corporations do business. While Nvidia and AMD are trading close to all-time highs, we prefer a lesser-known (but still profitable) stock benefiting from the rise of AI. Click here to access our free report one of our favorites growth stories.
Operating Margin
Operating margin is a key measure of profitability. Think of it as net income - the bottom line - excluding the impact of taxes and interest on debt, which are less connected to business fundamentals.
ThredUp’s operating margin might fluctuated slightly over the last 12 months but has remained more or less the same, averaging negative 21.9% over the last two years. Unprofitable consumer discretionary companies that fail to improve their losses or grow sales rapidly deserve extra scrutiny. For the time being, it’s unclear if ThredUp’s business model is sustainable.
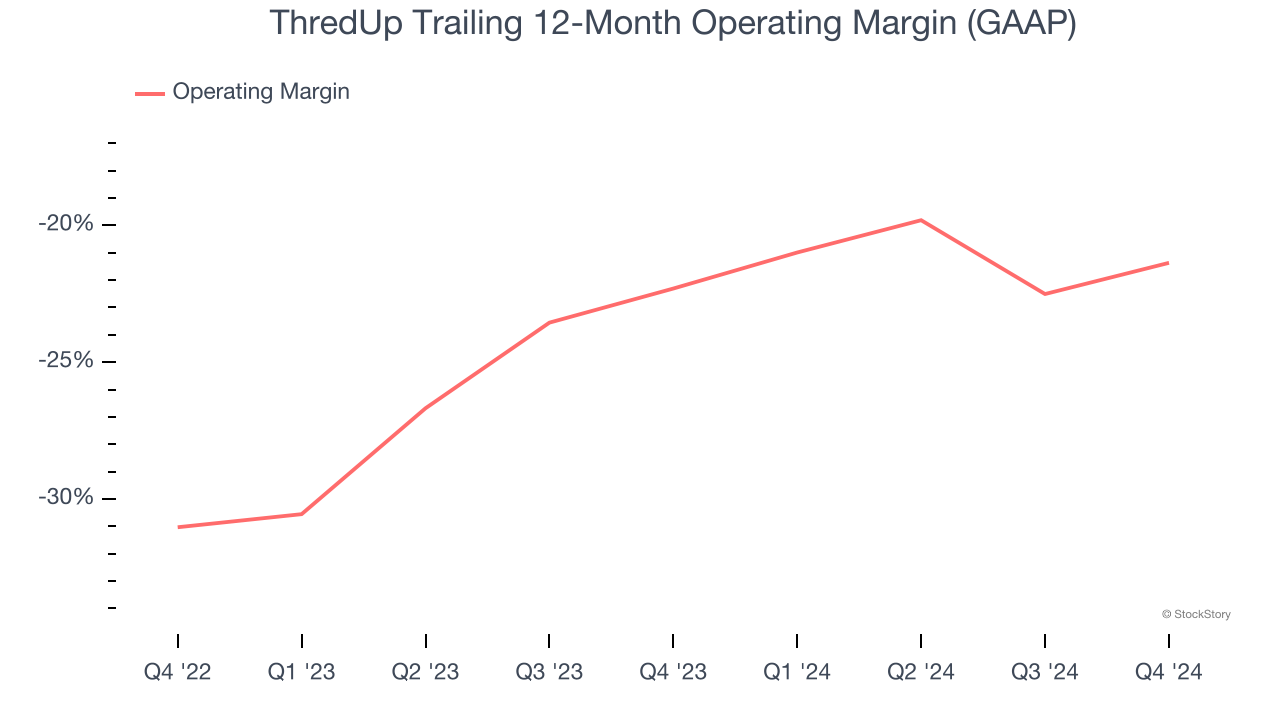
In Q4, ThredUp generated a negative 12.1% operating margin. The company's consistent lack of profits raise a flag.
Earnings Per Share
Revenue trends explain a company’s historical growth, but the long-term change in earnings per share (EPS) points to the profitability of that growth – for example, a company could inflate its sales through excessive spending on advertising and promotions.
Although ThredUp’s full-year earnings are still negative, it reduced its losses and improved its EPS by 24.9% annually over the last five years. The next few quarters will be critical for assessing its long-term profitability.
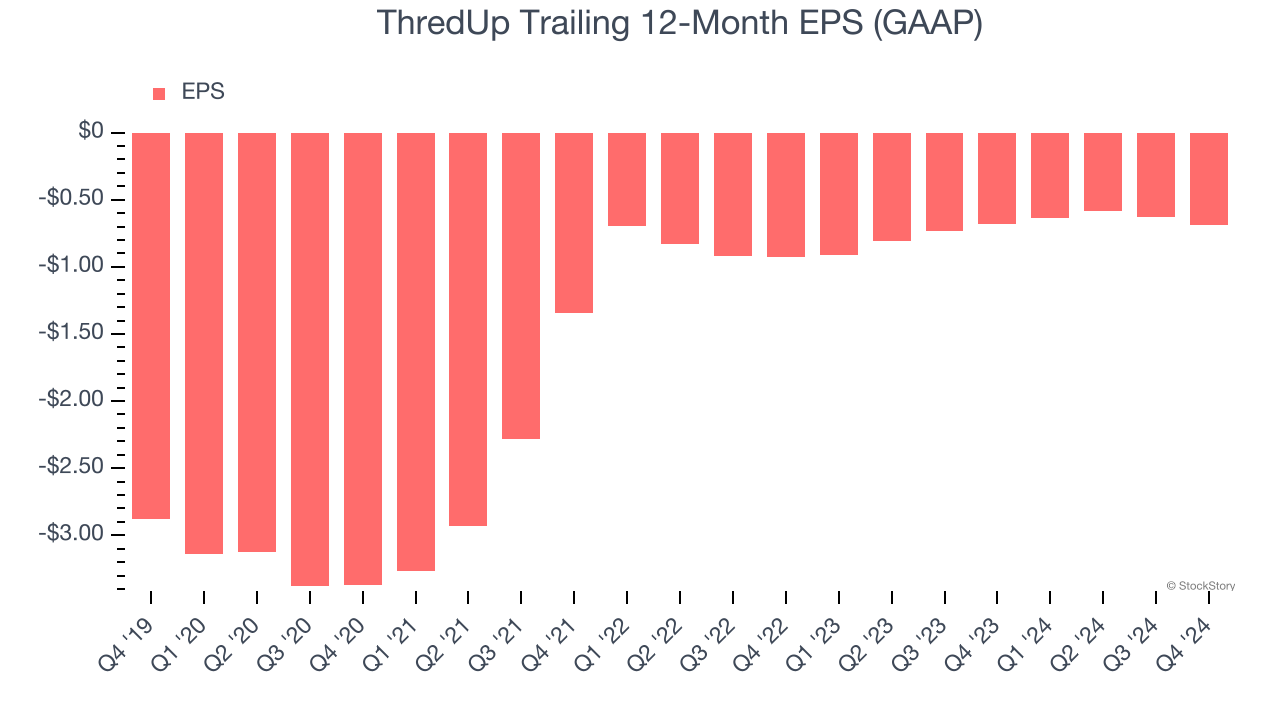
In Q4, ThredUp reported EPS at negative $0.19, down from negative $0.14 in the same quarter last year. This print missed analysts’ estimates. Over the next 12 months, Wall Street is optimistic. Analysts forecast ThredUp’s full-year EPS of negative $0.69 will reach break even.
Key Takeaways from ThredUp’s Q4 Results
We were impressed by how significantly ThredUp blew past analysts’ EBITDA expectations this quarter. We were also glad its full-year revenue guidance trumped Wall Street’s estimates. On the other hand, its number of orders missed and its EPS fell short of Wall Street’s estimates. Overall, we think this was still a solid quarter with some key areas of upside. The stock remained flat at $2.24 immediately following the results.
So should you invest in ThredUp right now? When making that decision, it’s important to consider its valuation, business qualities, as well as what has happened in the latest quarter. We cover that in our actionable full research report which you can read here, it’s free.