

RV manufacturer Thor Industries (NYSE:THO) reported Q4 CY2024 results beating Wall Street’s revenue expectations, but sales fell by 8.6% year on year to $2.02 billion. Its GAAP loss of $0.01 per share was significantly below analysts’ consensus estimates.
Is now the time to buy THOR Industries? Find out by accessing our full research report, it’s free.
THOR Industries (THO) Q4 CY2024 Highlights:
- Revenue: $2.02 billion vs analyst estimates of $2 billion (8.6% year-on-year decline, 1.1% beat)
- EPS (GAAP): -$0.01 vs analyst estimates of $0.06 (significant miss)
- Operating Margin: 0.5%, in line with the same quarter last year
- Free Cash Flow was $22.42 million, up from -$132 million in the same quarter last year
- Sales Volumes rose 3.8% year on year, in line with the same quarter last year
- Market Capitalization: $5.07 billion
“At the beginning of fiscal 2025, we foresaw that the first half of our fiscal year would be challenging and that certainly has proven to be accurate. Our focus on maintaining a healthy balance between wholesale and retail activity enabled our segments to hold margins reasonably well with consolidated gross margins for the second quarter of fiscal 2025 at 12.1% compared to 12.3% for the prior-year period. As we anticipated and messaged at the beginning of our fiscal year, our North American Motorized and European segments have both seen a year-over-year decline in gross margins while our North American Towable segment has seen meaningful improvement on a year-over-year basis, with gross margins up 370 basis points over the same quarter last year. Our consolidated margin this quarter was also impacted by actions we took to deepen our partnerships with key dealers. Strategically, deepening these key relationships is important to our long-term market position. These strategic decisions position THOR well as we look ahead. The takeaway for this quarter and for the first half of our fiscal year is that we performed as we expected,” said Todd Woelfer, Senior Vice President and Chief Operating Officer.
Company Overview
Created through the acquisition and merger of various RV manufacturers, THOR Industries manufactures and sells a range of recreational vehicles, including motorhomes and travel trailers, catering to consumers seeking the freedom and comfort of the RV lifestyle.
Automobile Manufacturing
Much capital investment and technical know-how are needed to manufacture functional, safe, and aesthetically pleasing automobiles for the mass market. Barriers to entry are therefore high, and auto manufacturers with economies of scale can boast strong economic moats. However, this doesn’t insulate them from new entrants, as electric vehicles (EVs) have entered the market and are upending it. This has forced established manufacturers to not only contend with emerging EV-first competitors but also decide how much they want to invest in these disruptive technologies, which will likely cannibalize their legacy offerings.
Sales Growth
A company’s long-term sales performance can indicate its overall quality. Any business can have short-term success, but a top-tier one grows for years. Over the last five years, THOR Industries grew its sales at a weak 1.1% compounded annual growth rate. This fell short of our benchmarks and is a poor baseline for our analysis.
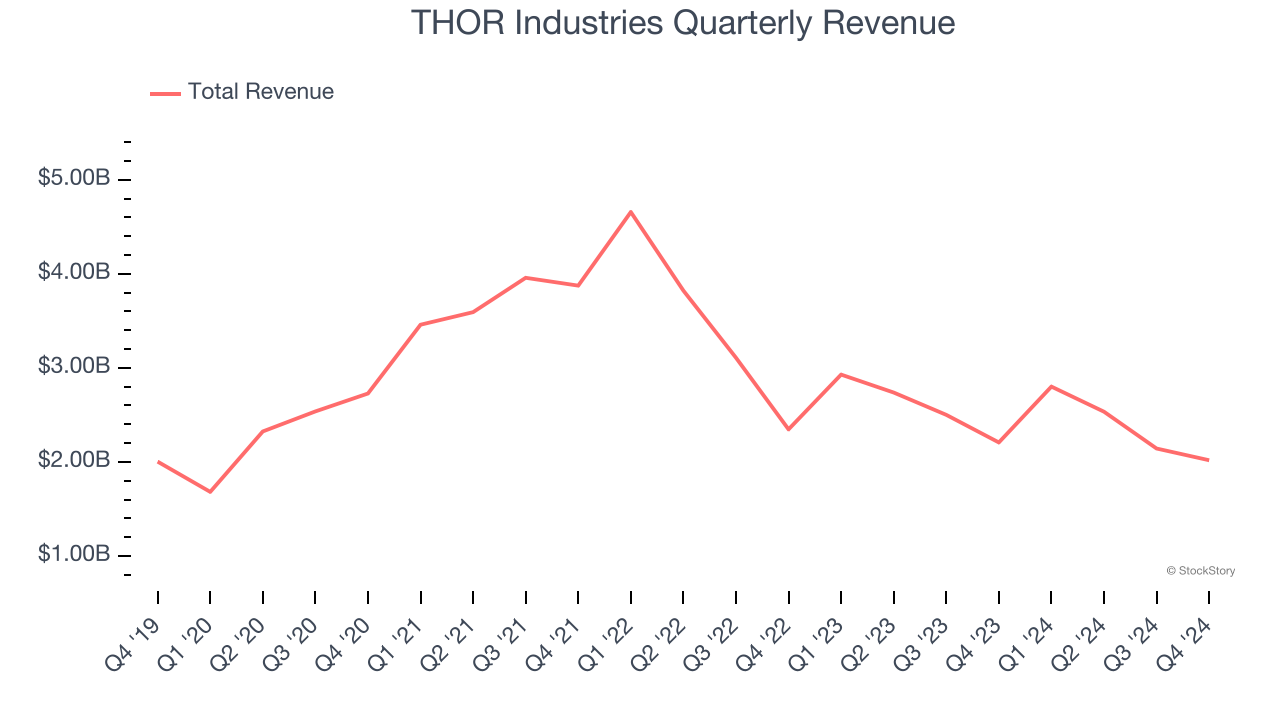
We at StockStory place the most emphasis on long-term growth, but within industrials, a half-decade historical view may miss cycles, industry trends, or a company capitalizing on catalysts such as a new contract win or a successful product line. THOR Industries’s history shows it grew in the past but relinquished its gains over the last two years, as its revenue fell by 17.4% annually. 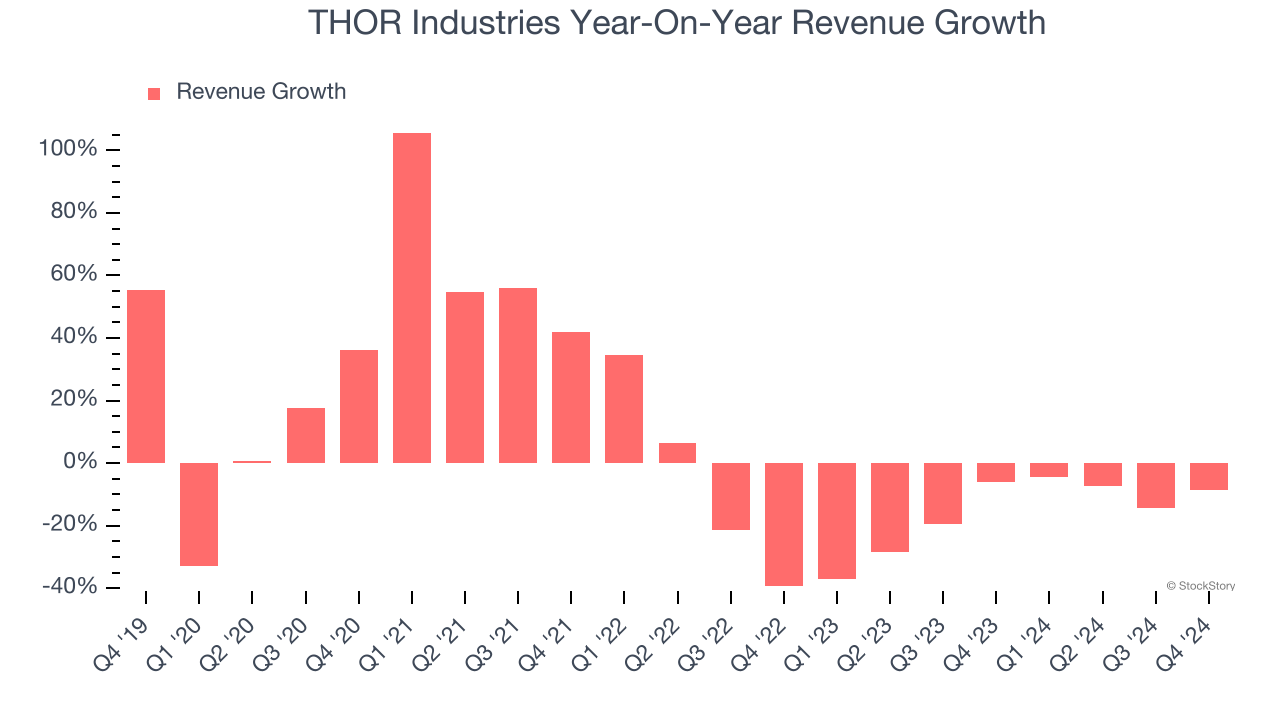
We can dig further into the company’s revenue dynamics by analyzing its number of units sold, which reached 40,981 in the latest quarter. Over the last two years, THOR Industries’s units sold averaged 9.8% year-on-year declines. Because this number is better than its revenue growth, we can see the company’s average selling price decreased. 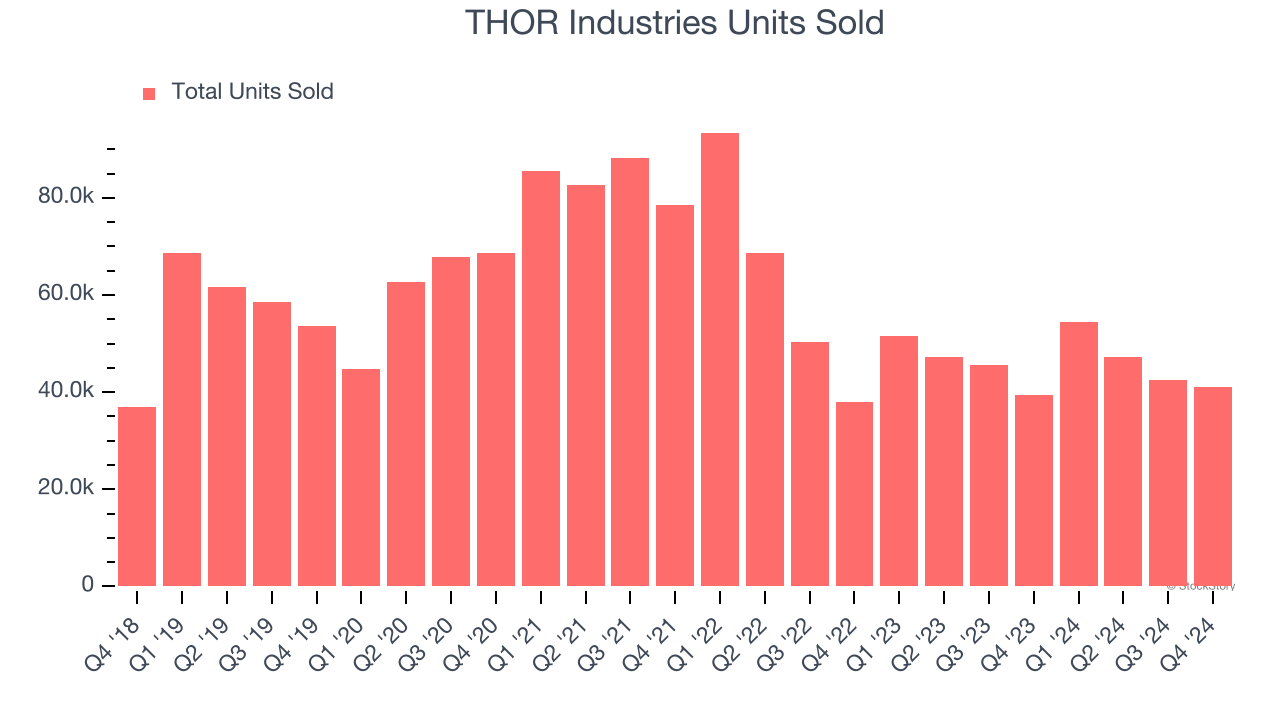
This quarter, THOR Industries’s revenue fell by 8.6% year on year to $2.02 billion but beat Wall Street’s estimates by 1.1%.
Looking ahead, sell-side analysts expect revenue to grow 2.4% over the next 12 months. Although this projection indicates its newer products and services will fuel better top-line performance, it is still below average for the sector.
Unless you’ve been living under a rock, it should be obvious by now that generative AI is going to have a huge impact on how large corporations do business. While Nvidia and AMD are trading close to all-time highs, we prefer a lesser-known (but still profitable) stock benefiting from the rise of AI. Click here to access our free report one of our favorites growth stories.
Operating Margin
Operating margin is a key measure of profitability. Think of it as net income - the bottom line - excluding the impact of taxes and interest on debt, which are less connected to business fundamentals.
THOR Industries was profitable over the last five years but held back by its large cost base. Its average operating margin of 6.4% was weak for an industrials business. This result isn’t too surprising given its low gross margin as a starting point.
Looking at the trend in its profitability, THOR Industries’s operating margin decreased by 2.8 percentage points over the last five years. This raises questions about the company’s expense base because its revenue growth should have given it leverage on its fixed costs, resulting in better economies of scale and profitability. . THOR Industries’s performance was poor no matter how you look at it - it shows that costs were rising and it couldn’t pass them onto its customers.
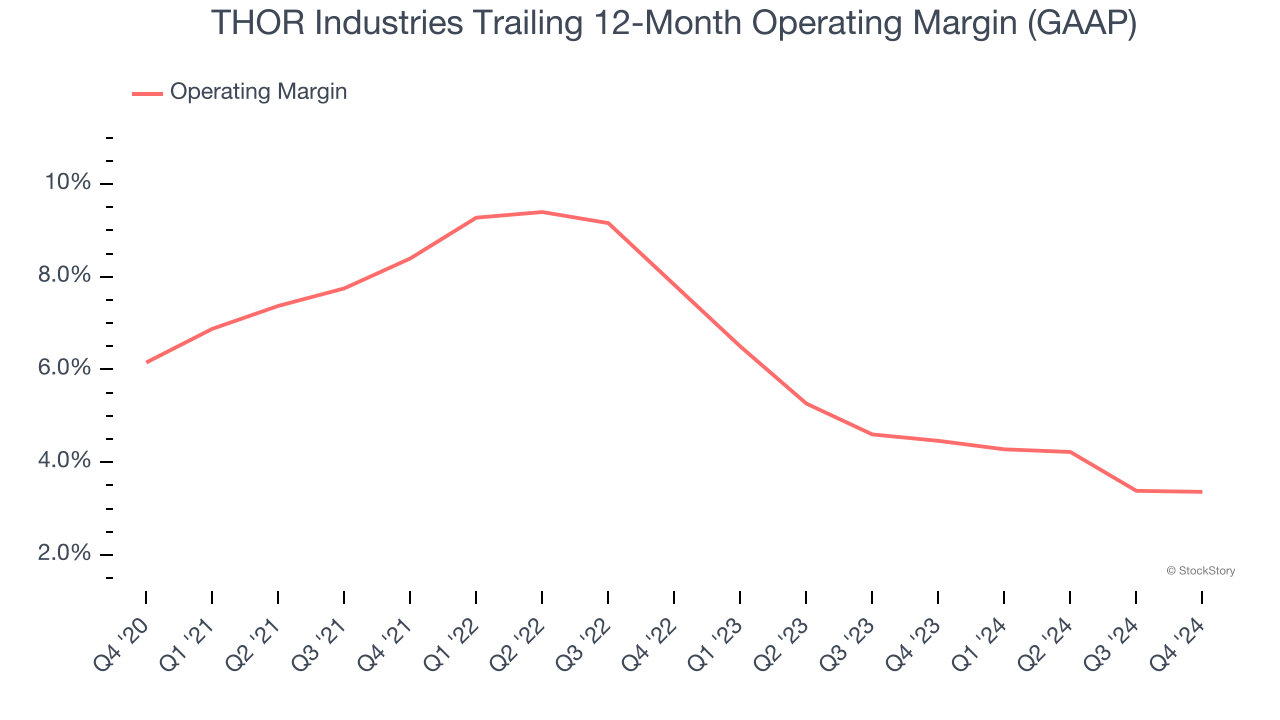
This quarter, THOR Industries’s breakeven margin was in line with the same quarter last year. This indicates the company’s cost structure has recently been stable.
Earnings Per Share
Revenue trends explain a company’s historical growth, but the long-term change in earnings per share (EPS) points to the profitability of that growth – for example, a company could inflate its sales through excessive spending on advertising and promotions.
THOR Industries’s flat EPS over the last five years was below its 1.1% annualized revenue growth. This tells us the company became less profitable on a per-share basis as it expanded due to non-fundamental factors such as interest expenses and taxes.
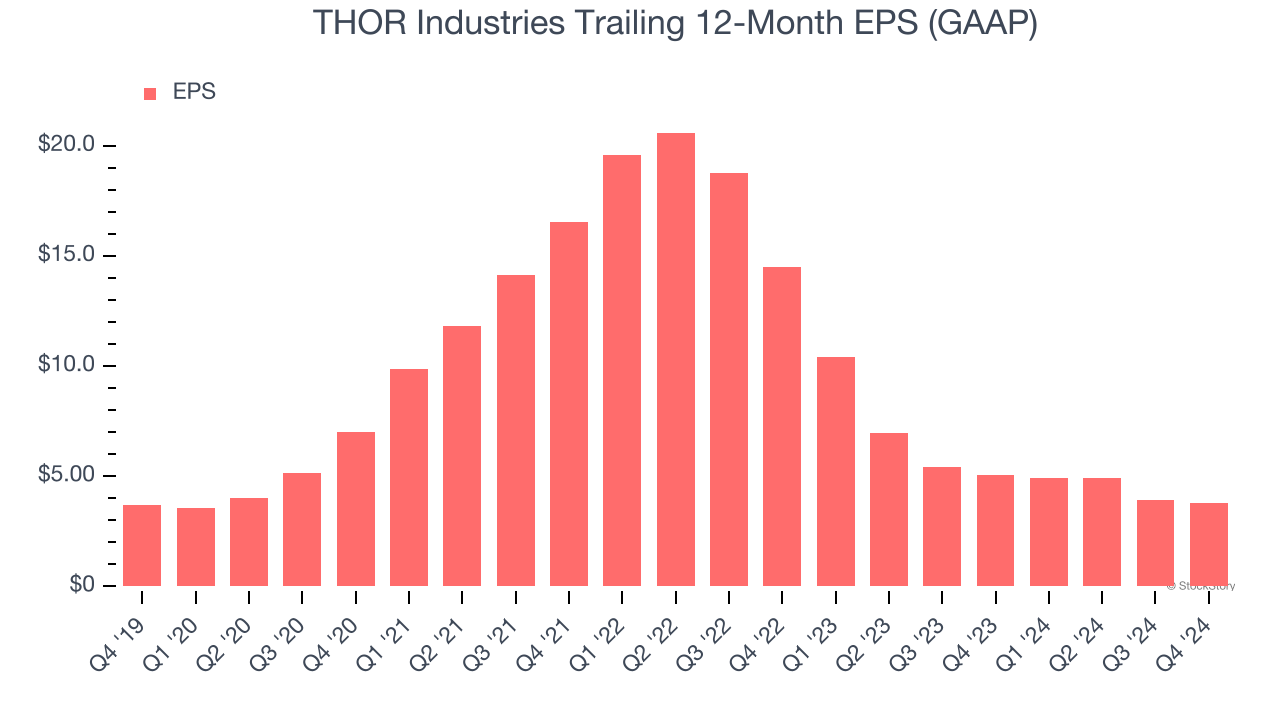
Like with revenue, we analyze EPS over a shorter period to see if we are missing a change in the business.
THOR Industries’s two-year annual EPS declines of 49% were bad and lower than its two-year revenue performance.
In Q4, THOR Industries reported EPS at negative $0.01, down from $0.13 in the same quarter last year. This print missed analysts’ estimates. Over the next 12 months, Wall Street expects THOR Industries’s full-year EPS of $3.77 to grow 52.5%.
Key Takeaways from THOR Industries’s Q4 Results
We were impressed by how significantly THOR Industries blew past analysts’ sales volume expectations this quarter. We were also happy its revenue narrowly outperformed Wall Street’s estimates. On the other hand, its EPS fell short of Wall Street’s estimates. Overall, this was a weaker quarter.
Should you buy the stock or not? We think that the latest quarter is only one piece of the longer-term business quality puzzle. Quality, when combined with valuation, can help determine if the stock is a buy. We cover that in our actionable full research report which you can read here, it’s free.